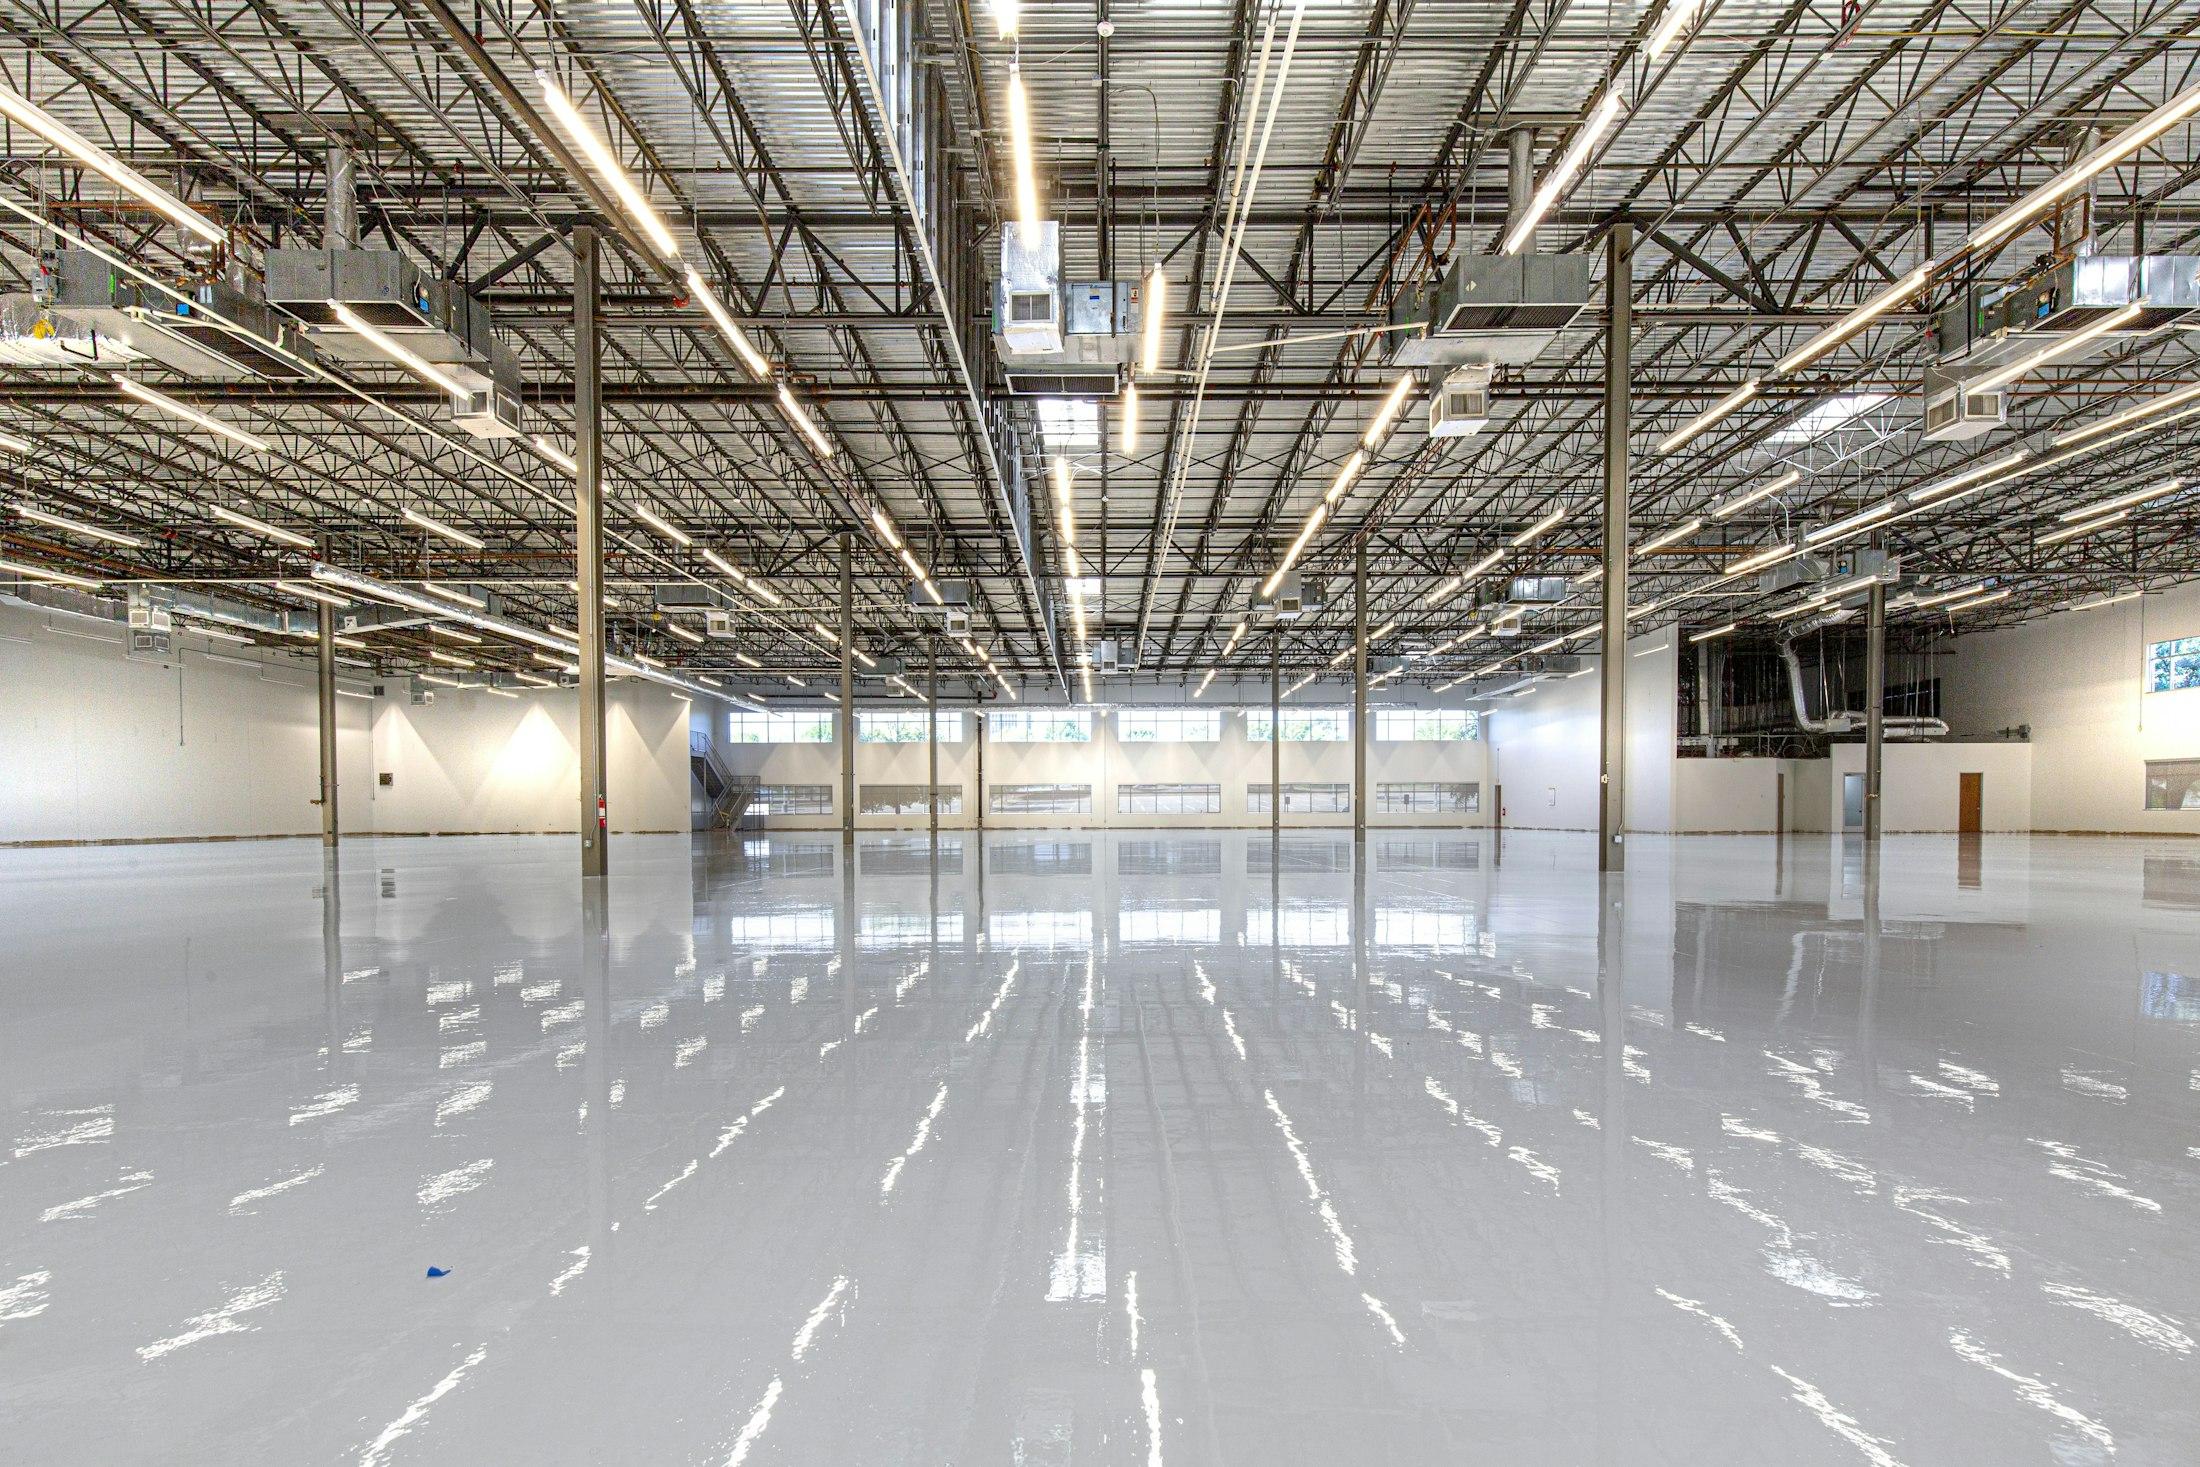
Case study 03 · Construction Services
Concrete Polishing, Waterproofing
& Coating.
An established Northern California contractor run by an absentee owner, offered at $849,000. The price looks modest; the proposed seller note does not.
A · Executive overview
A reasonable multiple undone by its financing terms.
The company polishes, waterproofs and coats concrete for commercial customers in Northern California. It was established in 2003, reports 20 full-time employees, and is run by an absentee owner working about two hours a week. Premises are leased at $4,554 a month.
It is offered at $849,000 against reported revenue of $2,406,911, SDE of $316,390 and EBITDA of $205,483. The price includes $791,803 of stated equipment and $3,500 of inventory.
At 2.68x SDE the ask sits inside the sector range. The proposed seller note, 25% of the price repaid over three years, is what makes the economics fail.
- Industry
- Construction services
- Location
- Northern California
- Established
- 2003 (~23 years)
- Employees
- 20 full-time (reported)
- Owner involvement
- Absentee, ~2 hours a week
- Premises
- Leased, $4,554 a month
- Included assets
- $792k equipment, $3.5k inventory
- Reporting period
- Not disclosed
Principal acquisition considerations
- A three-year seller note adds $79,814 a year of debt service.
- Total debt service of $200,603 against $117,796 of modeled cash.
- The owner holds the licence the business operates under.
- The operator allowance is a proxy, not a verified salary.
B · Financial snapshot
What the listing reports.
Revenue
Reported$2,406,911
Period undisclosed
Seller SDE
Reported$316,390
Seller-reported
EBITDA
Reported$205,483
Seller-reported
Asking price
Reported$849,000
As listed
Ask / SDE
Derived2.68x
Sector range 1.72x–2.98x
Ask / EBITDA
Derived4.13x
On seller-reported EBITDA
Stated equipment of $791,803 is 93% of the asking price; its valuation basis and condition are unverified.
C · Earnings & cash flow analysis
Two lenders to pay, one cash flow.
Annual, USD
Earnings bridge
View data table
| Step | Amount | Running total |
|---|---|---|
| Seller SDE | $316,390 | $316,390 |
| Screening haircut | ($39,549) | $276,841 |
| Adjusted SDE | $276,841 | $276,841 |
| Operator allowance | ($110,907) | $165,934 |
| Maintenance capex | ($48,138) | $117,796 |
| Cash for debt | $117,796 | $117,796 |
| Debt service | ($200,603) | ($82,807) |
| Annual shortfall | ($82,807) | ($82,807) |
D · Acquisition financing
A seller note that front-loads the burden.
Capital structure
Sources and uses at the asking price
Uses of funds
$1,071,365
- Purchase price$849,000 · 79%
- Working capital$180,939 · 17%30 days of operating expenses
- Closing costs$23,490 · 2%$15k fixed + 1% of price
- SBA upfront fee$17,936 · 2%3.25% × 75% guaranteed
Sources of funds
$1,071,365
- SBA 7(a) loan$753,772 · 70%10.25%, 10-year amortisation
- Seller note$212,250 · 20%25% of price, 8%, 3 years, paying
- Buyer cash equity$105,343 · 10%10% of project cost
View data table
| Item | Amount | Share |
|---|---|---|
| Use: Purchase price | $849,000 | 79.2% |
| Use: Working capital | $180,939 | 16.9% |
| Use: Closing costs | $23,490 | 2.2% |
| Use: SBA upfront fee | $17,936 | 1.7% |
| Source: SBA 7(a) loan | $753,772 | 70.4% |
| Source: Seller note | $212,250 | 19.8% |
| Source: Buyer cash equity | $105,343 | 9.8% |
Annual debt service
Derived$200,603
SBA $120,790 · seller $79,814
Total uses
Derived$1,071,365
Price + WC + costs + fee
Buyer cash for 1.25x at ask
Derived$753,315
Up from $105,343
Financing assumptions in detail
- Interest rate
- 10.25%, 10-year amortisation; illustrative, not a lender quote.
- Seller note
- 25% of purchase price at the seller-advertised 8%, three-year term, equal monthly payments, no standby.
- Upfront fee
- 3.25% of the 75% guaranteed portion, financed.
- Working capital
- $180,939: 30 days of estimated operating expenses ((revenue − EBITDA) ÷ 365 × 30).
- Closing costs
- $15,000 fixed allowance plus 1% of price; pending itemised quotes.
- Operator allowance
- $110,907, equal to the SDE−EBITDA difference; a temporary proxy.
E · Debt-service coverage
Coverage of 0.59x, with the seller note doing the damage.
Cash for debt service ÷ annual debt service
Coverage against the screening threshold
View data table
| Scenario | Cash for debt service | Annual debt service | Coverage |
|---|---|---|---|
| SBA debt only | $117,796 | $120,790 | 0.98x |
| Base case | $117,796 | $200,603 | 0.59x |
| Downside | $94,237 | $200,603 | 0.47x |
F · Valuation & supportable price
Inside the market range, far above financing capacity.
Seller SDE basis
Asking price in context
Comparison band 1.72x–2.98x reported earnings (median 2.25x)
Asking price as listed
Price the modeled financing can carry at 1.25x
View data table
| Reference | Value | Multiple of reported cash flow |
|---|---|---|
| Sector low (lower quartile) | $544,191 | 1.72x |
| Sector median | $711,878 | 2.25x |
| Sector high (upper quartile) | $942,842 | 2.98x |
| Seller asking price | $849,000 | 2.68x |
| Debt-supported ceiling | $322,917 | 1.02x |
BizBuySell concrete-business benchmarks (sold businesses, 2021–2025) put the range at 1.72x–2.98x seller SDE, median 2.25x. At 2.68x the ask is about 19% above the median but inside the range.
Holding the structure constant, the modeled financing supports about $322,917, a gap of $526,083. The constraint is cash flow relative to a short seller note, not the headline multiple.
A debt-supported ceiling is not fair market value. It measures what this financing structure can carry from modeled cash flow.
G · Scenario analysis
No tested assumption rescues the structure.
Working-capital and operator-cost scenarios from the workbook, shown as a static comparison. Even at 60% of the operator allowance, coverage stays below 1.0x.
Static comparison: interactive controls are offered only where the full model has been validated (see Case 01).
From the workbook · static
Working-capital scenarios
| Scenario | Coverage | Ceiling / note |
|---|---|---|
| 15 days of opex$90,470 | 0.63x | $389,023 |
| 20 days of opex$120,626 | 0.61x | $366,988 |
| 30 days of opex$180,939 | 0.59x | $322,917 |
| 45 days of opex$271,409 | 0.55x | $256,811 |
| 60 days of opex$361,879 | 0.52x | $190,704 |
From the workbook · static
Operator-cost scenarios
| Scenario | Coverage | Ceiling / note |
|---|---|---|
| 60% of base$66,544 | 0.81x | $498,450 |
| 80% of base$88,726 | 0.70x | $410,684 |
| Base$110,907 | 0.59x | $322,917 |
| 120% of base$133,088 | 0.48x | $235,151 |
| 140% of base$155,270 | 0.37x | $147,384 |
H · Key investment risks
Transferability is as uncertain as the cash flow.
Status reflects documented screening flags: raised, not disclosed or clear. No numerical risk scores are assigned.
| Category | Screening status | Finding | Diligence required |
|---|---|---|---|
| Financing feasibility | Flag raised | 0.59x coverage and an $82,807 annual shortfall. | Written financing terms; a restructured seller note. |
| Seller-note structure | Flag raised | 25% of price amortised over three years adds $79,814 a year from day one. | Negotiate longer term or standby. |
| Licensing continuity | Flag raised | The owner holds the licence the business operates under. | Qualifier arrangement and licence transfer path. |
| Management cost | Not disclosed | Operator allowance equals the SDE−EBITDA gap; existing management pay is unconfirmed. | Payroll and SDE-to-EBITDA reconciliation. |
| Capital expenditure | Not disclosed | $791,803 of stated equipment; condition and valuation basis unverified. | Equipment register and inspection. |
| Workforce | Not disclosed | Contractor (1099) share unknown in a licensed trade. | Classification review and staff retention. |
| Customer concentration | Not disclosed | No customer breakdown; a single revenue figure cannot show trend. | Three years of revenue by customer. |
| Lease & occupancy | Not disclosed | Lease assignment terms are unconfirmed. | Lease and landlord consent. |
| Operating history | No flag | Established in 2003. | None specific at Stage 1. |
| Valuation | No flag | 2.68x SDE is inside the 1.72x–2.98x sector range. | Equipment-backed value review. |
Financing feasibility
Flag raised0.59x coverage and an $82,807 annual shortfall.
Diligence: Written financing terms; a restructured seller note.
Seller-note structure
Flag raised25% of price amortised over three years adds $79,814 a year from day one.
Diligence: Negotiate longer term or standby.
Licensing continuity
Flag raisedThe owner holds the licence the business operates under.
Diligence: Qualifier arrangement and licence transfer path.
Management cost
Not disclosedOperator allowance equals the SDE−EBITDA gap; existing management pay is unconfirmed.
Diligence: Payroll and SDE-to-EBITDA reconciliation.
Capital expenditure
Not disclosed$791,803 of stated equipment; condition and valuation basis unverified.
Diligence: Equipment register and inspection.
Workforce
Not disclosedContractor (1099) share unknown in a licensed trade.
Diligence: Classification review and staff retention.
Customer concentration
Not disclosedNo customer breakdown; a single revenue figure cannot show trend.
Diligence: Three years of revenue by customer.
Lease & occupancy
Not disclosedLease assignment terms are unconfirmed.
Diligence: Lease and landlord consent.
Operating history
No flagEstablished in 2003.
Diligence: None specific at Stage 1.
Valuation
No flag2.68x SDE is inside the 1.72x–2.98x sector range.
Diligence: Equipment-backed value review.
I · Final investment assessment
Decline at $849,000 under
the modeled financing.
After the haircut, operator allowance and maintenance capex, the business generates $117,796 a year against $200,603 of debt service: 0.59x coverage and an $82,807 annual shortfall. A 20% decline in cash available lowers coverage to 0.47x.
The headline multiple is reasonable. The three-year seller note is not: it adds almost $80,000 a year of payments the cash flow cannot carry.
What would justify reconsideration: A restructured seller note (longer term or standby), a price closer to the ~$323,000 financing capacity, or verified earnings that restore at least 1.25x base coverage with acceptable downside liquidity.
Required due diligence
- Three years of financials and tax returns
- SDE-to-EBITDA reconciliation and payroll
- Receivables ageing and equipment register
- Lease and written financing terms
- Licence qualifier and transfer path
Material unresolved assumptions
- Reporting period
- Management cost
- Working capital at close
- Licence transferability
Assessment basis: memorandum dated 23 October 2026 and the supplied screening workbook. Listing claims and model assumptions are not independently verified. Not a quality-of-earnings assessment, independent valuation or lending approval.
J · Sample deliverables
What a client receives.
A public excerpt of the screening model: inputs, financing and outputs, each labelled by basis. Workbook formulas and internal tabs are not published.
| Section | Item | Value | Basis |
|---|---|---|---|
| Listing | Asking price | 849,000 | Reported |
| Listing | Revenue | 2,406,911 | Reported |
| Listing | Seller SDE | 316,390 | Reported |
| Listing | EBITDA | 205,483 | Reported |
| Earnings | Adjusted SDE (12.5% haircut) | 276,841 | Derived |
| Earnings | Operator allowance | 110,907 | Assumption |
| Earnings | Maintenance capex | 48,138 | Assumption |
| Earnings | Cash for debt service | 117,796 | Derived |
| Financing | SBA 7(a) loan | 753,772 | Derived |
| Financing | Seller note (25%, 8%, 3 yrs) | 212,250 | Assumption |
| Financing | Buyer cash equity | 105,343 | Derived |
| Outputs | Annual debt service | 200,603 | Derived |
| Outputs | Base DSCR | 0.59x | Derived |
| Outputs | Downside DSCR (cash -20%) | 0.47x | Derived |
| Outputs | Annual shortfall | -82,807 | Derived |
| Outputs | Debt-supported ceiling | 322,917 | Derived |